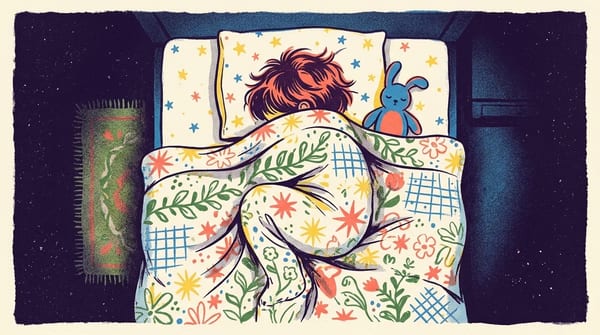
There is an old saying that children grow in their sleep. Scientists have found hints that it may be partly true, but there is no good evidence that more sleep makes a child taller. However, there are good reasons to make sure your child gets enough sleep, and they are to do with your child's weight.
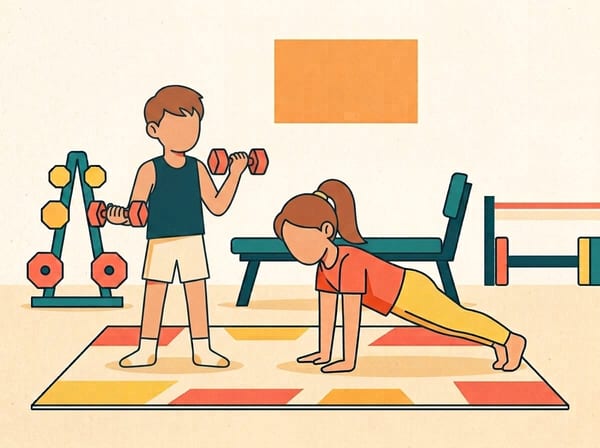
Most parents think lifting weights is dangerous for children. Twenty years of paediatric consensus disagree, and the reason has more to do with the nervous system than with muscle.
Parents are told that writing by hand is vital for their child's growing brain, and that screens are eroding it. We sort the viral headlines from the solid evidence, and find the real benefit belongs to one group above all: children still learning their letters.
8% free school meals0% English as an additional language (Year 6)43% SEN support (Year 6)
Year 6 results
Reading, writing and maths
This school57%
West Sussex60%
England63%
Share of Year 6 pupils meeting the expected standard in reading, writing and maths, 2024/25.
Year
School
West Sussex
England
2022/23
57%
56%
60%
2023/24
73%
57%
61%
2024/25
57%
60%
63%
3-year average
62%
30 pupils took the tests in 2025, so each child moves the school's result by about 3 percentage points. Results in small schools swing from year to year; the three-year average is steadier.
Average scaled scores in 2025: reading 107, maths 104 (100 is the expected standard). Higher standard in reading, writing and maths: 7%.
There are no results for 2019/20 or 2020/21, when the tests were cancelled. What do SATs scores mean?
Inspection
What Ofsted found
Most recent inspection, published 22/11/2023: School remains Good.
This was a shorter check that confirms an earlier grade rather than giving a new one. Ofsted moved to report cards in November 2025.
Good level of development at the end of Reception 2024/25similar
67.8%
68.3%
Phonics check met in Year 1 2024/25similar
79.2%
79.8%
Year 6 children living with obesity 2024/25lower
18.4%
22.2%
MMR two doses by age 5 2024/25higher
87.8%
83.7%
Primary pupils persistently absent 2024/25lower
11.7%
13.0%
Children in relative low-income families (under 16) 2024/25lower
12.8%
19.8%
“Higher” or “lower” means the difference from England is bigger than the margin of error; “similar” means it isn’t. These are figures for all children in the council area, not for any one school or child.